But one High Peak area has also seen a rise in the number of cases – up 550%.
The figures, which cover the seven days up to April 11 are from the Government’s interactive coronavirus map which is updated daily at 4pm.
The map shows the number of new cases recorded during the seven period rate, as well as the direction of change.
Images are for illustrative purposes only.
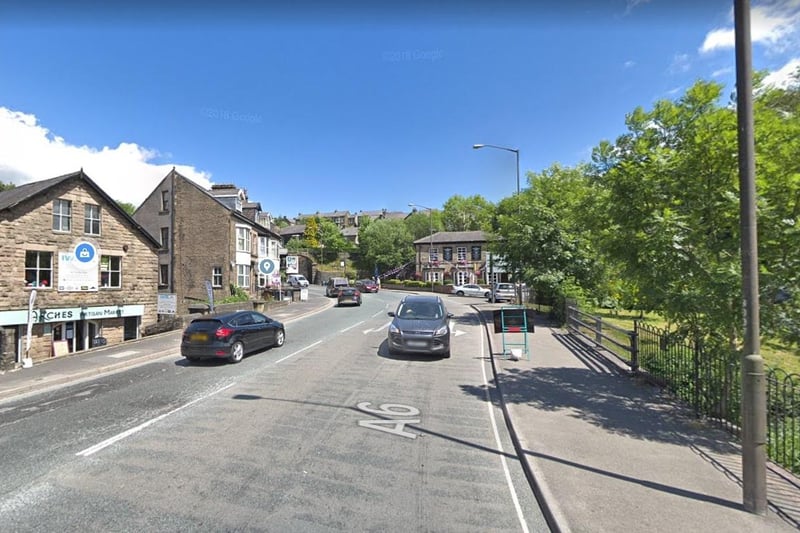
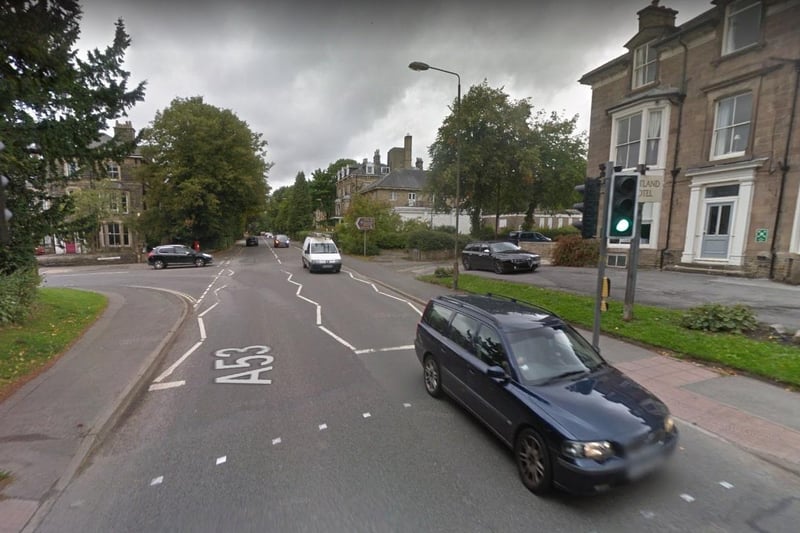
2. Buxton North
There were fewer than three cases. In this instance, no further data is provided. Photo: Google
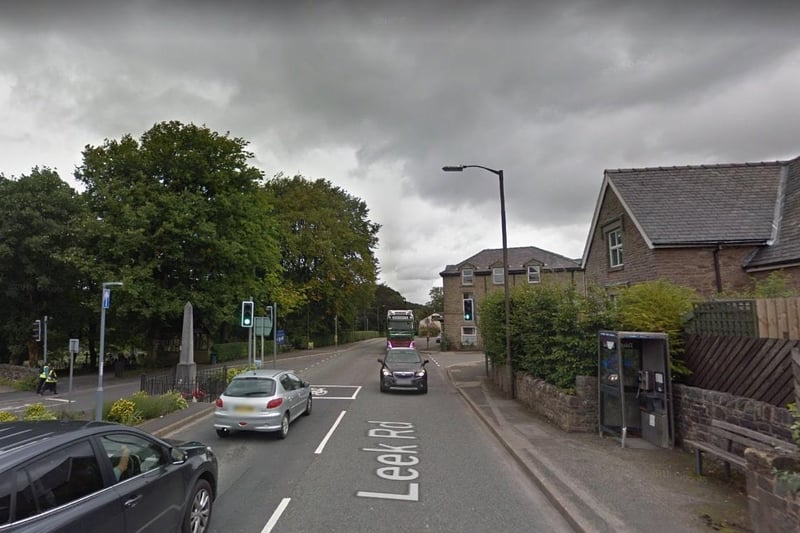
3. Buxton Burbage and Harpur Hill
There were fewer than three cases. In this instance, no further data is provided. Photo: Google
1 / 4
